- Supported reports
- Requirements
- Pipeline Security
- Project Security Dashboard
- Group Security Dashboard
- Instance Security Center
- Export vulnerabilities
- Keeping the dashboards up to date
- Security scans using Auto DevOps
- Vulnerability report
GitLab Security Dashboard, Security Center, and Vulnerability Reports
GitLab provides a comprehensive set of features for viewing and managing vulnerabilities:
- Security dashboards: An overview of the security status in your instance, groups, and projects.
- Vulnerability reports: Detailed lists of all vulnerabilities for the instance, group, project, or pipeline. This is where you triage and manage vulnerabilities.
- Security Center: A dedicated area for vulnerability management at the instance level. This includes a security dashboard, vulnerability report, and settings.
You can also drill down into a vulnerability and get extra information. This includes the project it comes from, any related file(s), and metadata that helps you analyze the risk it poses. You can also dismiss a vulnerability or create an issue for it.
To benefit from these features, you must first configure one of the security scanners.
Supported reports
The vulnerability report displays vulnerabilities detected by scanners such as:
- Container Scanning
- Dynamic Application Security Testing
- Dependency Scanning
- Static Application Security Testing
- And others!
Requirements
To use the security dashboards and vulnerability reports:
- At least one project inside a group must be configured with at least one of the supported reports.
- The configured jobs must use the new
reportssyntax. - GitLab Runner 11.5 or newer must be used. If you’re using the shared runners on GitLab.com, this is already the case.
Pipeline Security
Introduced in GitLab Ultimate 12.3.
At the pipeline level, the Security section displays the vulnerabilities present in the branch of the project the pipeline was run against.
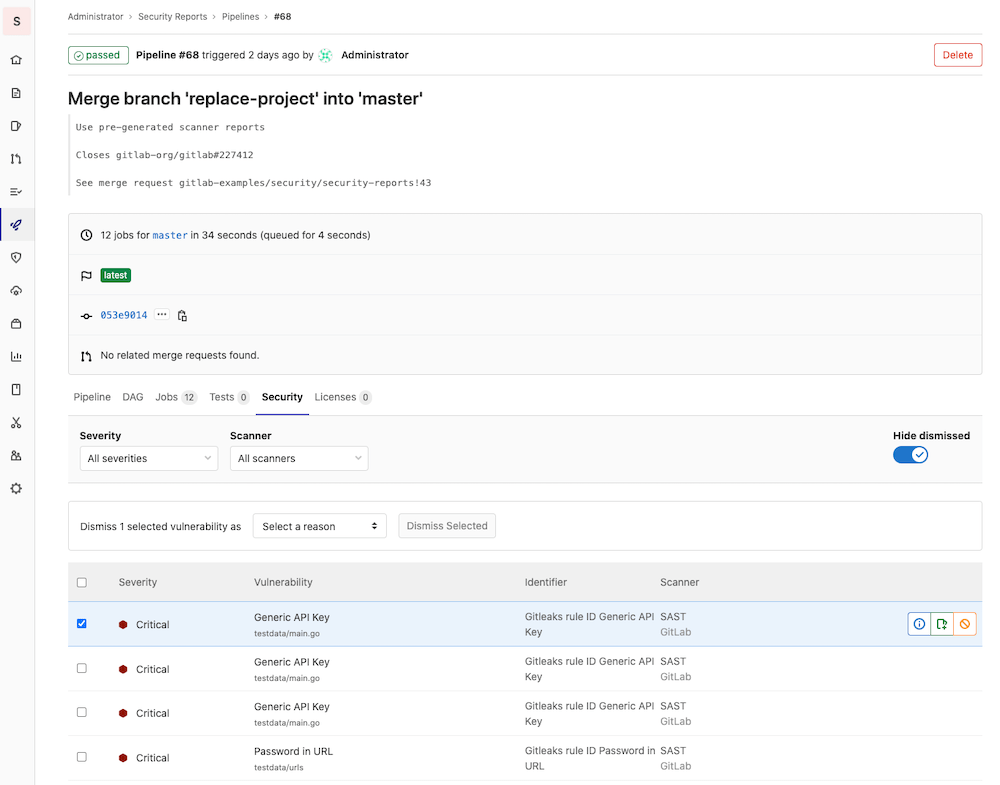
Visit the page for any pipeline that ran any of the supported reports. To view the pipeline’s security findings, select the Security tab when viewing the pipeline.
Project Security Dashboard
Introduced in GitLab Ultimate 11.1.
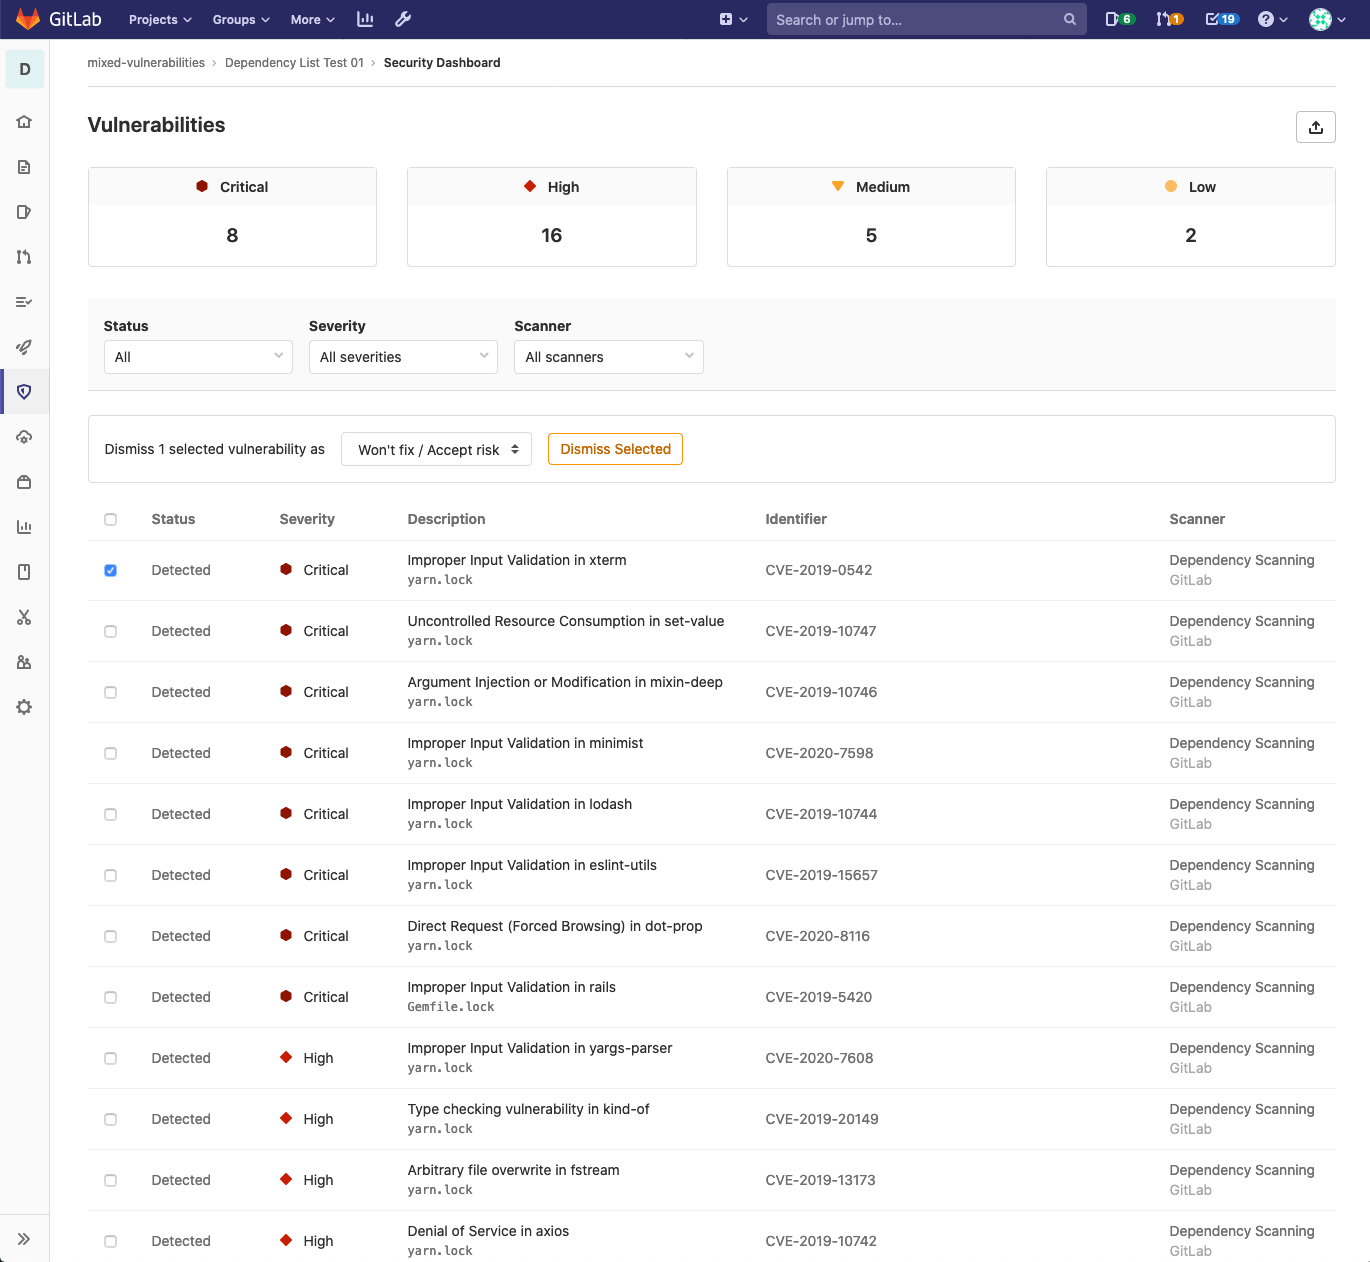
At the project level, the Security Dashboard displays the vulnerabilities merged into your project’s default branch. Access it by navigating to Security & Compliance > Security Dashboard. By default, the Security Dashboard displays all detected and confirmed vulnerabilities.
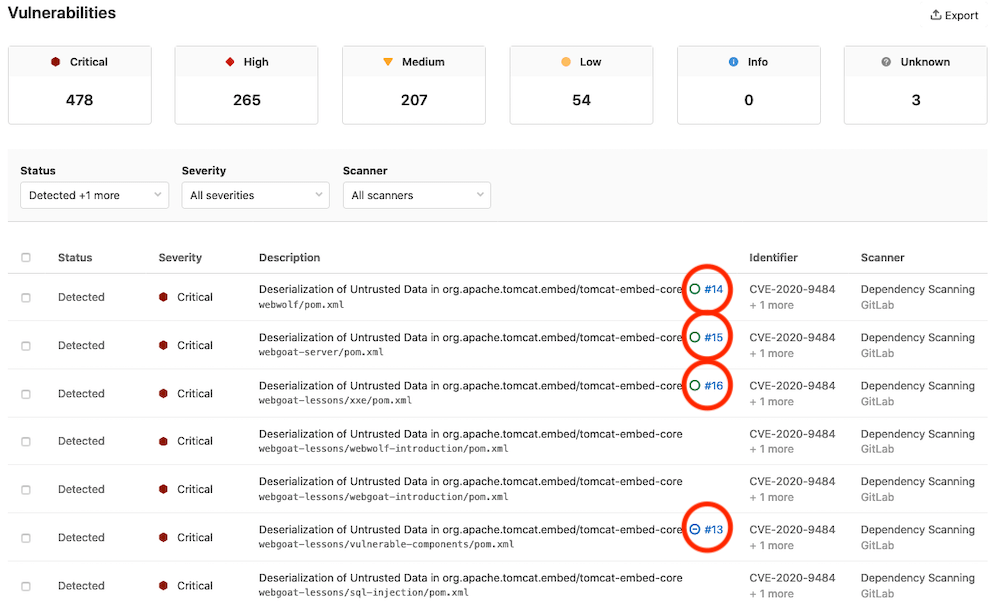
The Security Dashboard first displays the total number of vulnerabilities by severity (for example, Critical, High, Medium, Low, Info, Unknown). Below this, a table shows each vulnerability’s status, severity, and description. Clicking a vulnerability takes you to its Vulnerability Details page to view more information about that vulnerability.
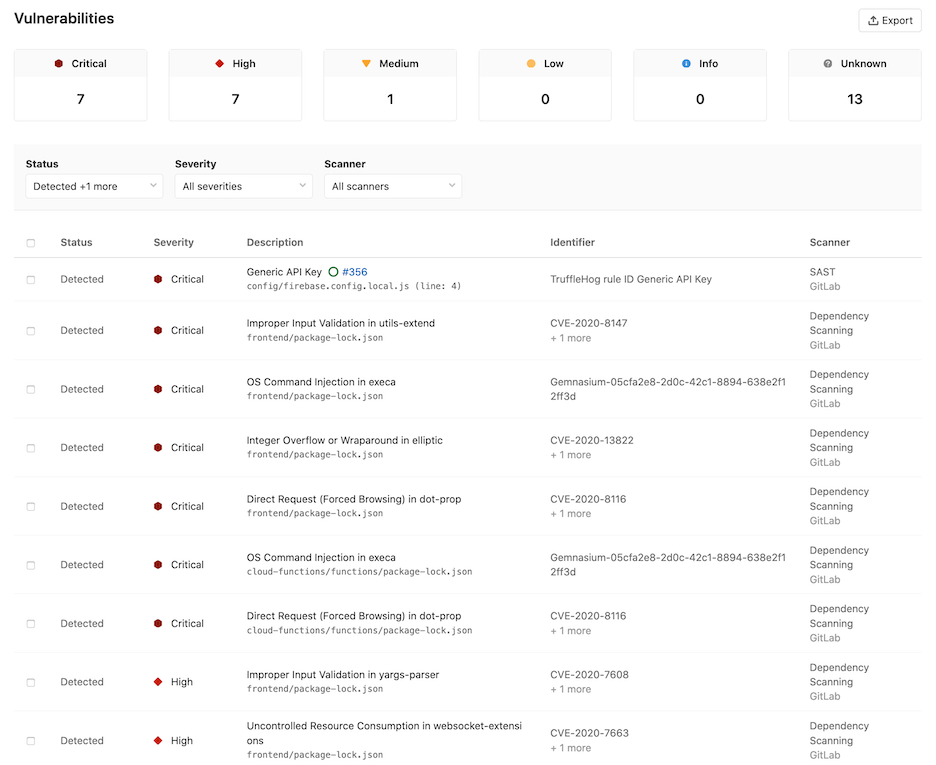
You can filter the vulnerabilities by one or more of the following:
- Status
- Severity
- Scanner
You can also dismiss vulnerabilities in the table:
- Select the checkbox for each vulnerability you want to dismiss.
- In the menu that appears, select the reason for dismissal and click Dismiss Selected.
Group Security Dashboard
Introduced in GitLab Ultimate 11.5.
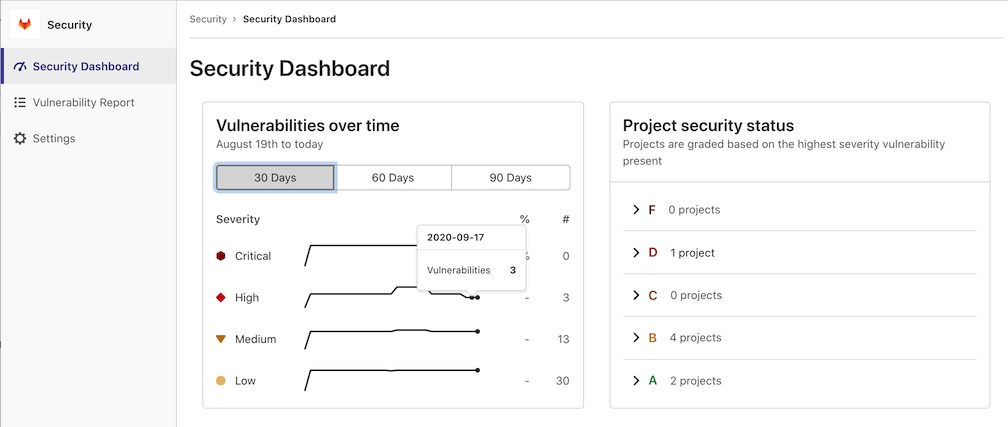
The group Security Dashboard gives an overview of the vulnerabilities in the default branches of the projects in a group and its subgroups. Access it by navigating to Security > Security Dashboard after selecting your group. By default, the Security Dashboard displays all detected and confirmed vulnerabilities. If you don’t see the vulnerabilities over time graph, the likely cause is that you have not selected a group.
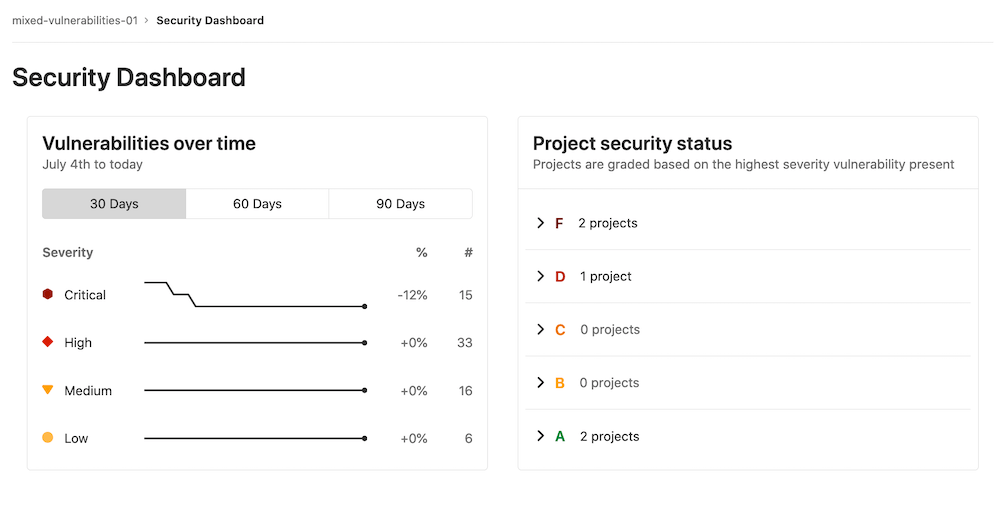
There is a timeline chart that shows how many open vulnerabilities your projects had at various points in time. You can display the vulnerability trends over a 30, 60, or 90-day time frame (the default is 90 days). Hover over the chart to get more details about the open vulnerabilities at a specific time.
Next to the timeline chart is a list of projects, grouped and sorted by the severity of the vulnerability found:
- F: One or more “critical”
- D: One or more “high” or “unknown”
- C: One or more “medium”
- B: One or more “low”
- A: Zero vulnerabilities
Projects with no vulnerability tests configured will not appear in the list. Additionally, dismissed vulnerabilities are excluded.
Navigate to the group’s vulnerability report to view the vulnerabilities found.
Instance Security Center
Introduced in GitLab Ultimate 13.4.
The Security Center is where you manage vulnerabilities for your instance. It displays the vulnerabilities present in the default branches of all the projects you configure. It includes the following:
- The group security dashboard’s features.
- A vulnerability report.
- A dedicated settings area to configure which projects to display.
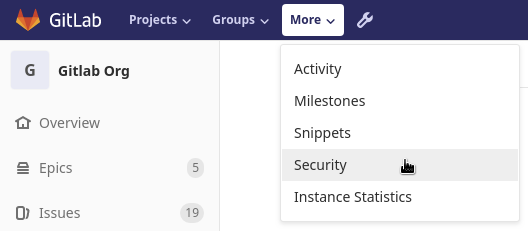
You can access the Instance Security Center from the menu bar at the top of the page. Under More, select Security.
The dashboard and vulnerability report are empty before you add projects.
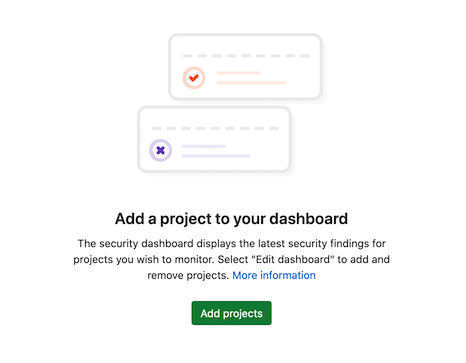
Adding projects to the Security Center
To add projects to the Security Center:
- Click Settings in the left navigation bar or click the Add projects button.
- Search for and add one or more projects using the Search your projects field.
- Click the Add projects button.
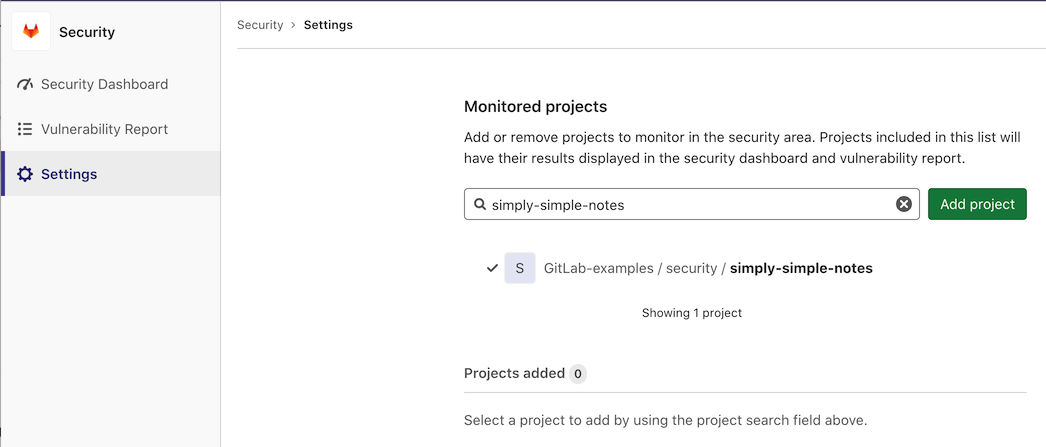
After you add projects, the security dashboard and vulnerability report display the vulnerabilities found in those projects’ default branches.
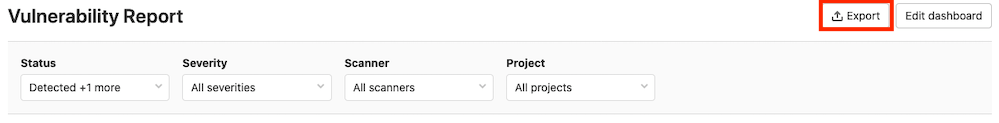
Export vulnerabilities
Introduced in GitLab Ultimate 12.10.
You can export all your vulnerabilities in CSV (comma separated values) format by clicking the Export button located at top right of the Security Dashboard. When the report is ready, the CSV report downloads to your local machine. The report contains all vulnerabilities for the projects defined in the Security Dashboard, as filters don’t apply to the export function.
The fields in the export include:
- Scanner Type
- Scanner Name
- Status
- Name
- Details
- Severity
- CVE
- Additional Info
Keeping the dashboards up to date
The Security Dashboard displays information from the results of the most recent security scan on the default branch, which means that security scans are performed every time the branch is updated.
If the default branch is updated infrequently, scans are run infrequently and the information on the Security Dashboard can become outdated as new vulnerabilities are discovered.
To ensure the information on the Security Dashboard is regularly updated, configure a scheduled pipeline to run a daily security scan. This will update the information displayed on the Security Dashboard regardless of how often the default branch is updated.
That way, reports are created even if no code change happens.
Security scans using Auto DevOps
When using Auto DevOps, use special environment variables to configure daily security scans.
Vulnerability report
Each vulnerability report contains vulnerabilities from the latest scans that were merged into the default branch.
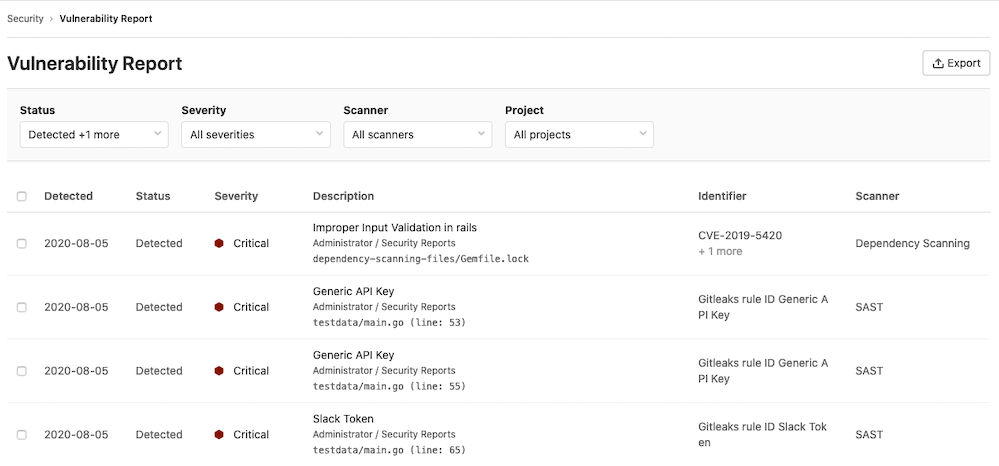
You can filter which vulnerabilities the vulnerability report displays by:
- Status
- Severity
- Scanner
- Project
Clicking any vulnerability in the table takes you to its Vulnerability Details page to see more information on that vulnerability. To create an issue associated with the vulnerability, click the Create Issue button.
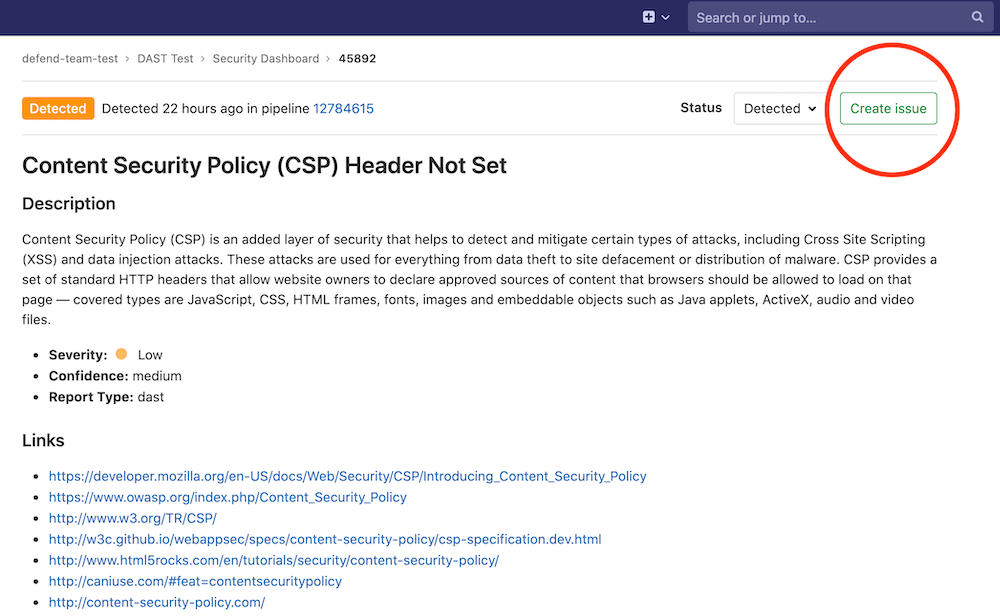
Once you create the issue, the vulnerability list contains a link to the issue and an icon whose color indicates the issue’s status (green for open issues, blue for closed issues).
Read more on how to interact with the vulnerabilities.